Turn Insights Into Impact

Smarter Decisions, Backed by Data

Insights delivers a centralized, real-time view of shopper behavior, performance metrics, and A/B test outcomes, helping you optimize with precision, not guesswork.

Request a Demo

Actionable Insights see what’s working and optimize what's not. Insights turns customer behavior into clear metrics and, with A/B testing, helps merchandisers optimize for engagement, conversion, and growth.

Line graph showing revenue trends from January to March, highlighting February 16 with 43% revenue from navigation and search.
Insights & A/B Testing

Search That Learns

Know which search terms convert, and which lead to dead ends, with AI-powered search that learns and adapts. Use zero-result insights, click-through rates, and real-time data to refine relevance, improve findability, and connect shoppers with the right products faster. Continuously test, measure, and optimize ranking rules to deliver a smarter, more intuitive search experience.

Line graph showing performance metrics for three campaigns (A, B, C) over time, with a total KPI of 76% on February 16.
Insights & A/B Testing

Merchandise With Impact

Gain clear insights into the real impact of your merchandising strategies and ranking configurations across channels. Understand which products convert and why, then use that data to guide campaigns, boost high-performing items, and fine-tune product listing pages with confidence. With intelligent merchandising, you can A/B test, refine, and continuously improve performance.

A display of related home decor products, featuring two tables with prices and a sidebar for distribution settings and rules.
Full Transparency

Verify, Analyze, and Optimize

Instantly access advanced analytics through a streamlined dashboard, review the impact of specific rules and recommendations, and make data-driven adjustments to better personalize the customer experience. Our Chrome extension puts actionable insights at your fingertips, helping you continuously verify, analyze, and optimize all personalization algorithms.


Insights & A/B Testing

A scenic landscape featuring two mountains under a bright sun, with a clear sky and minimal clouds.
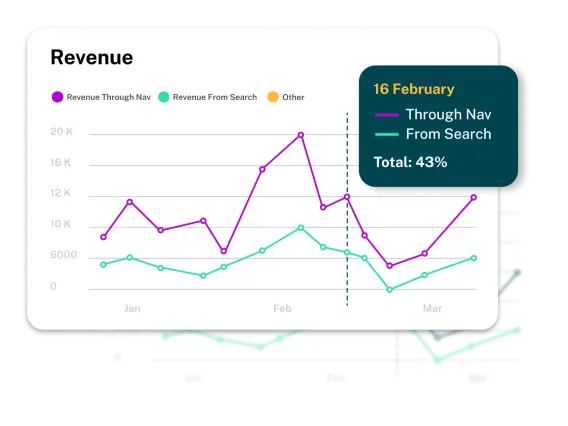
See the Full Picture
Track search, navigation, and campaign performance in one clean, visual dashboard. Spot trends, flag issues, and keep atuned across every channel.
A smiling businessman in a suit, with a dollar sign and a rising graph in the background, symbolizing financial growth and success.
Trade Smarter
Monitor how your product ranking strategies are performing and identify opportunities to optimise for better results
A stylized outline of a human head with a dollar sign and an upward trend graph, symbolizing financial growth and investment mindset.
Test Smarter, Grow Faster
Launch A/B tests with confidence. Measure variant performance across key metrics and know exactly which version wins and why.
A computer monitor displays a shirt icon and a percentage symbol, indicating a sale or discount on clothing.
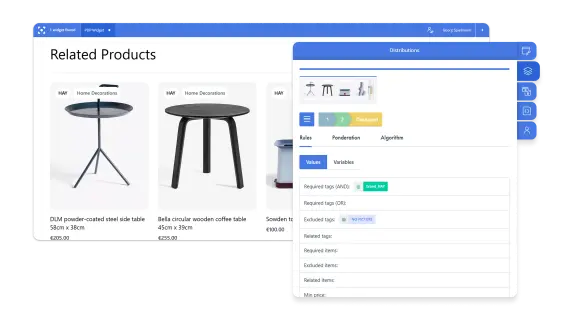
Know Your Products Inside Out
See which products are getting attention, which are ending up in baskets, and which are actually selling vs those which are underperforming. Use real data to power your next move.
A megaphone icon with smiling faces and hearts, symbolizing communication and positive engagement.
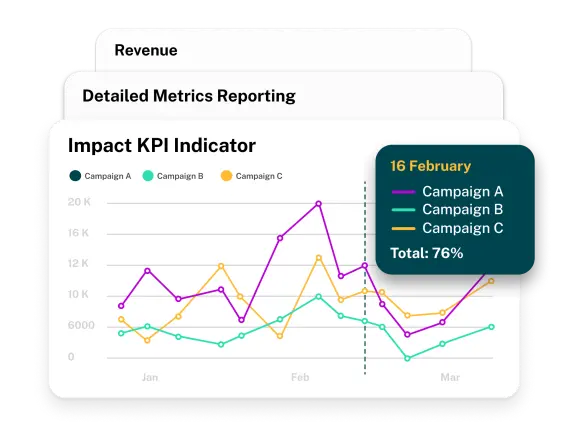
Measure Every Campaign
Don’t guess what’s working. Track impressions, clicks, adds-to-basket, and revenue for each campaign to double down on what delivers.
Two stylized heads with speech bubbles, connected by arrows, illustrating communication or information exchange between individuals.
Track Shopper Interactions
Know which filters and facets shoppers are actually using. Fine-tune navigation to make it easier for them to find what they want.
A magnifying glass over a document with bar graphs, symbolizing analysis or research of data.
Global Recommendation Insights
Track the overall impact of your recommendation strategy with high-level KPIs like assisted sales, impressions, clicks, and conversion rates, all tied to business outcomes.
A flowchart-like diagram showing a central table with branching connections to three separate data points or notes.
Widget-Level Performance Tracking
Measure the effectiveness of each widget individually, including views, clicks, add-to-carts, and revenue, to fine-tune performance across your site.
Harvey Nichols
A man sits at a table in a restaurant, holding a glass, with a bustling dining area and outdoor scenery in the background.
There is no doubt Fredhopper has helped Harvey Nichols to reach many of its digital goals. Product discovery and functionality are essential to the experience on our website.

Joseph Cook
Ecommerce Product Manager — Harvey Nichols

Let's Talk

Connect
With Our
Experts

Have questions?

Connect with one of our experts to explore how we can drive higher conversions, deliver more relevant experiences, and unlock new revenue opportunities.